Happy Tuesday, everyone! Last week was kinda bananalands in Northern Ontario – we received a healthy dose of snow. It was a rude awakening and an unfortunate sneak-peak at what’s to come in the next few months. I actually love winter, but mid-October is a little earlier than I think I’m ready for. Anyway, a little behind-the-scenes insight: I actually had another blog planned for this week about shaft sinking, but after having a thought-provoking conversation with one of my supervisors I decided to write this one instead. Blogs of this nature are always the easiest to write and tend to be my favourite ones content-wise, too. It’s always a fun day when I get to draw comparisons between my job and the knowledge that a physics degree has given me!
Two of my favourite math courses I took in university were Combinatorics as well as Chaos, Fractals, & Dynamics. They were somewhat “off the beaten path” and a lot less boring than say, a class on differential equations – and they also made math seem more “colourful” and interesting. There’s a lot of reasons as to why these courses were fun, and I suggest looking into these concepts if you are even mildly interested in math (If you’d like to learn more about them, watching this and this would be a good start). In this blog, I’ll be discussing how fractals are a good metaphor for how unexpectedly complicated some (seemingly simple) tasks are in the mining industry.
What are fractals? If you look on wikipedia, you’ll find that it says “a fractal is a self-similar subset of Euclidean space whose fractal dimension strictly exceeds its topological dimension”. Okay – while this may be something that I happen to have the “toolbox” to understand, it’s not an overly helpful definition for those who do not care about math. Moreover, some mathematicians disagree with the notion that fractals should be well-defined at all! So I’ll do my best to explain it in a different way, in the way that I think is most relevant to this post. A fractal is a mathematical thing: kind of like a line, graph, or geometrical shape. We can use equations to describe what it looks like. One way that we construct fractals is by investigating what happens when we apply a function to a number over and over and over again. For instance, take the function y=x2. Let’s start with iterating the number x=2.
22 = 4
42 = 16
162 = 256, and so on…
If we begin with the number 2 and keep applying the function y=x2 (ie. keep squaring the resulting number) the number we get after every step will keep getting bigger and bigger. However, if we were to do the same thing to the number 0.5, we would get 0.25, then 0.0625, then 0.00390625, and so on: the number will get smaller and smaller. If we start with the number 0 or 1, it will remain 0 or 1 no matter how many times we square it. The takeaway here is that even though we are always working with the same function y=x2, when iterating all of these numbers the long-term behaviour changes depending on the initial number we chose. Now suppose I label all of the numbers that eventually “blow up” with the colour blue – and all of the numbers that don’t, I label black. In that case, for y=x2 we’d have that any number between -1 and 1 is black and all the other numbers are blue, like so:

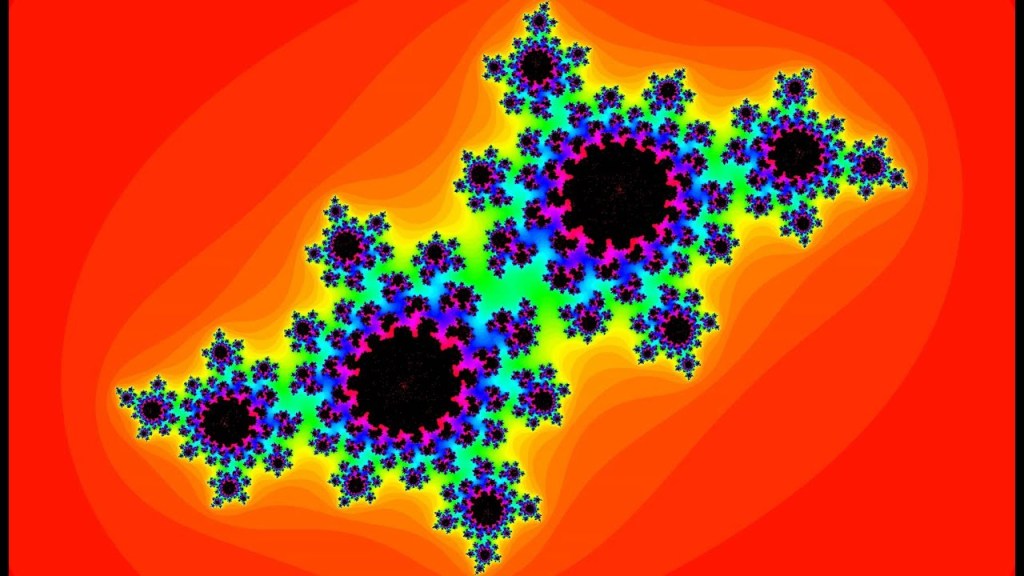
Notice that where the blue & black regions meet, the graph stays fairly simple. It’s just a well-defined switch from the blue to black regions. It’s obvious and intuitive that anything near the edge in the black region is black, and everything near the edge in the blue region is also blue. Now for our next example, we will look at our first fractal – the Mandelbrot set:

One of the most popular fractals is the Mandelbrot Set – pictured above. It is a fractal in the complex plane, meaning that it involves the imaginary number i. Our number line for y=x2 was just a one dimensional line, but the Mandelbrot set is actually a two-dimensional shape. It’s actually similar to a complex version of the equation y=x2, but instead of only iterating over “real” numbers like 0, 1, 0.5, and 2, we can also plug in a number like 4+3i, which is a complex number (for our purposes, we can think of it as like a two-dimensional number). Do not worry so much about this! The equation for the Mandelbrot set is fc(z) = z2 + c, where we “choose” the complex number “c” and we always begin with z=0 (Also, do not worry about the notation “fc(z)”, it’s just a more helpful way of writing “y”. If it helps, you can instead write the Mandelbrot Set equation as y = z2 + c). So for instance, if we choose c=2, then the iterations would look like this:
f2(0) = 02 + 2 = 2
f2(2) = 22 + 2 = 6
f2(6) = 62 + 2 = 38, and so on…
Much like with y=x2, when we iterate over c=2 the number gets bigger and bigger with every step.
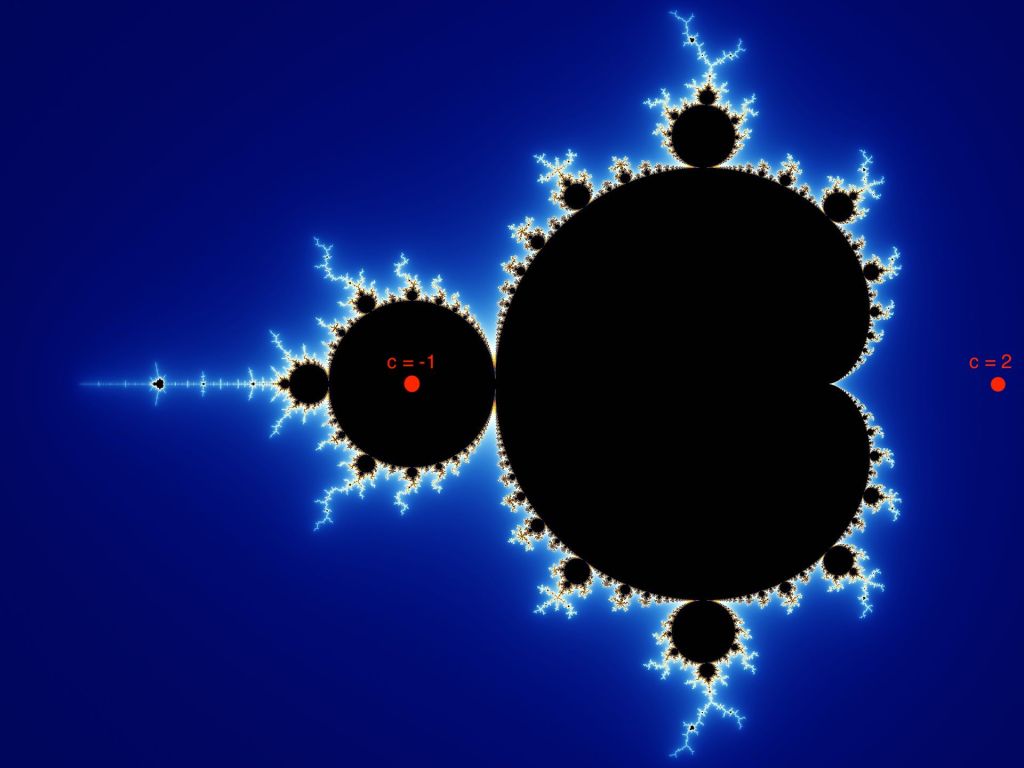
On the complex plane, we find the number 2 in the blue region of the Mandelbrot Set graph above. Like before, the reason it’s in the blue region is because it “blows up” to infinity after applying the fc(z) function many times. That’s how we define the Mandelbrot set, which are all the numbers located in the black region – they are the numbers that do not “blow up” after applying fc(z) function to them over and over again. They are analogous to the numbers such as 0, 1, 0.5 for the function y=x2 which do not “blow up” to infinity when squaring after every step. Any numbers located in the blue or other coloured regions eventually “blow up”. Let’s try this! The number c = -1 is in the black region, so let’s see it for ourselves:
f-1(0) = 02 + (-1) = -1
f-1(-1) = (-1)2 + -1 = 0
f-1(0) = (0)2 + (-1) = -1
f-1(-1) = (-1)2 + -1 = 0, and so on..
Iterating c = -1 through fc(z) actually gives us a repeating cycle! This means it will never “blow up”, it will always just bounce back and forth between -1 and 0, which is why c = -1 is in the black region of the graph.
So what makes the Mandelbrot Set interesting? Well, it’s kind of unpredictable. That seems strange, right? It should be easy to just plug in a number and iterate it. However, notice that near the “edges” of the black regions we have some lighter colours being shown. The “brighter” the colour is, the “slower” it blows up. So any numbers in the blue-er regions blow up quickly after only a few iterations (like c = 2), whereas the yellow-er regions take far more iterations to “blow up” – some numbers may take so many steps/iterations that it would be easy to convince ourselves that it doesn’t “blow up” at all, even though it does!
This makes the Mandelbrot set not so straightforward – the edges of the black regions are wildly unpredictable and chaotic, unlike our y=x2 number line. Say we pick a number “c” near the edge of the black region and we iterate it a whole bunch of times and determine that it doesn’t blow up. Suppose we then change “c” just a tiny bit – well, there’s no way we can guarantee that it does or doesn’t blow up before actually trying it. Moreover, it may be the case that two numbers very close together blow up at completely different speeds. Moral of the story: a small change in our initial choice of “c” can correspond to monumentally different results. This is what we would call “chaos” theory.
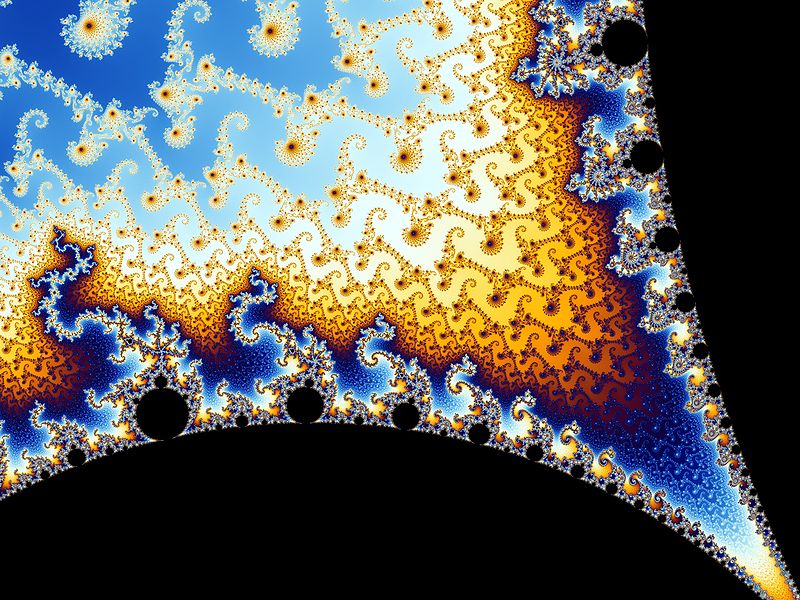
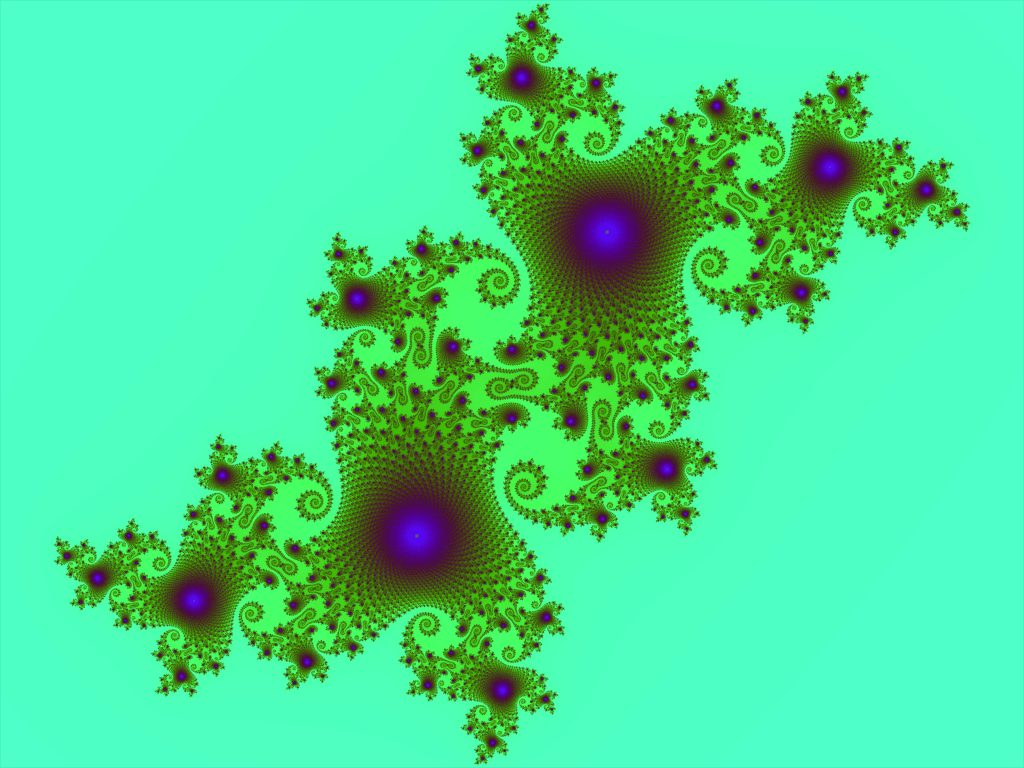
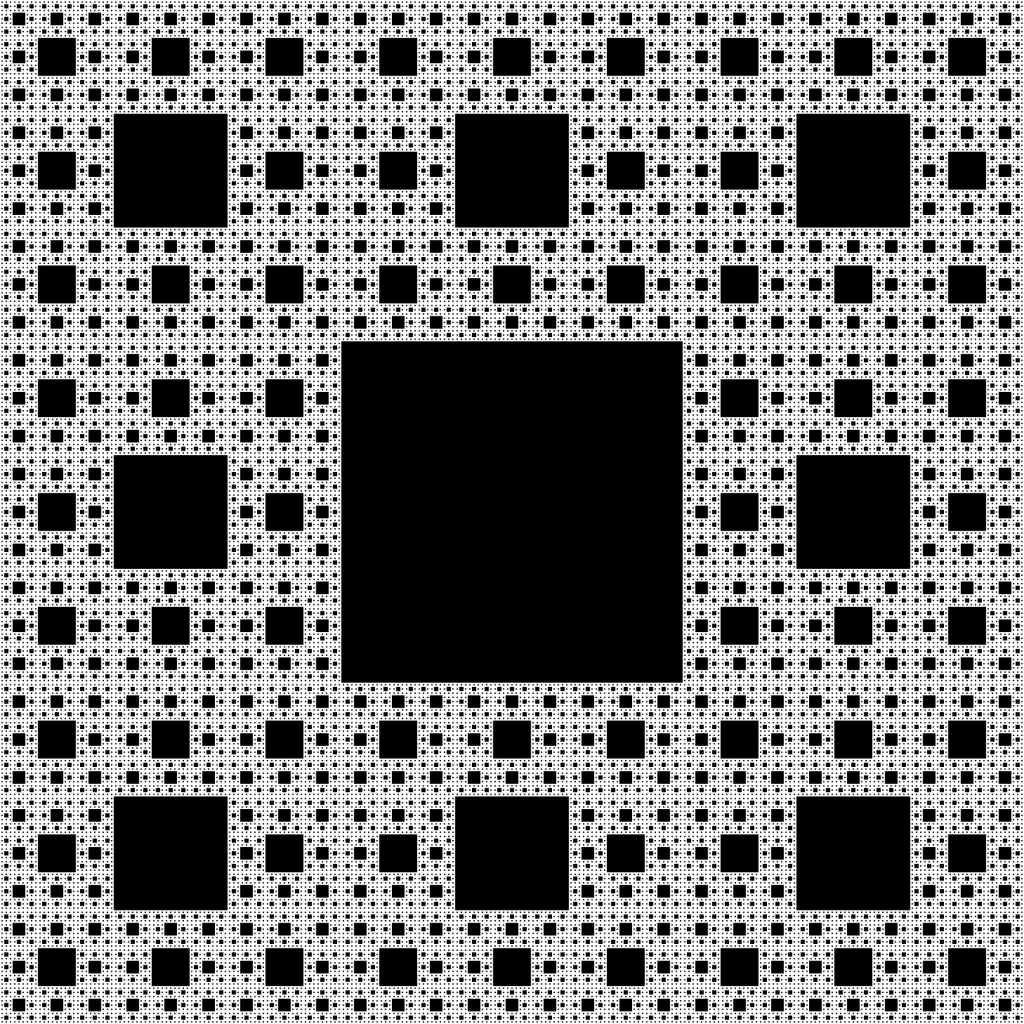
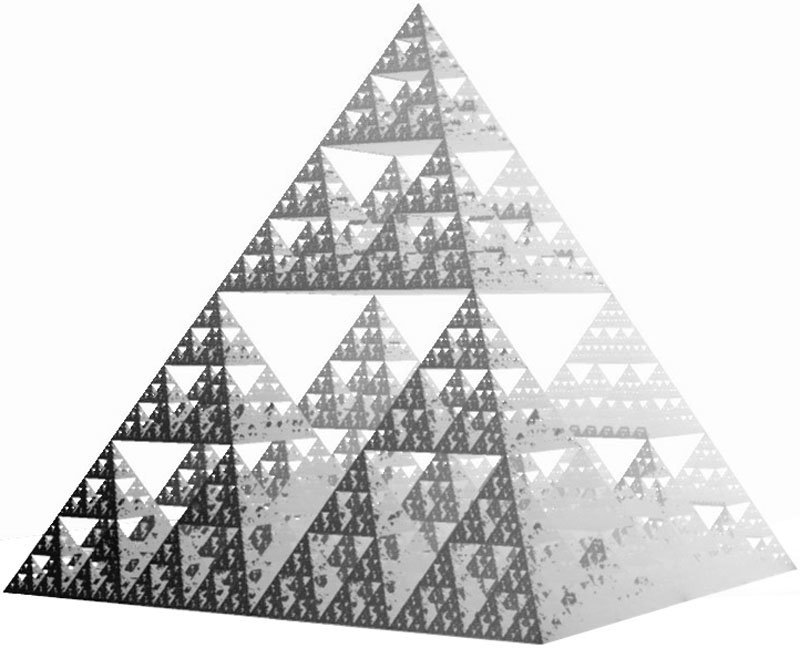
In math, we are often used to being able to “zoom in” on an object to make it more simple. In fact, that’s kind of how Calculus works (to my mathematician friends – I’m sorry but that’s as elegant as I care to put it). For instance, if we were to “zoom in” on the edge of a circle, we would eventually get to the point where we may think we are looking at a simple straight line; Exactly in the same way that the earth seems flat because we are so tiny (“zoomed in”) compared to it. However, when “zooming” in on the edge of the Mandelbrot set, things don’t get simple at any point or degree of zoom – It is consistently chaotic, complex and unpredictable. This video demonstrates the idea. There are many other popular fractals aside from the Mandelbrot Set – such as the Sierpinski Carpet, Sierpinski Pyramid, or Julia sets, shown below.
So how does any of this relate to mining, at all? Well, last week my supervisor and I had a conversation about some of the tasks required to operate the mine at a profit. He is familiar with the idea of a fractal (perhaps I annoyed him by talking about them at some point in the past), and we made the connection between the chaotic & complex nature of a fractal and the chaotic & complex nature of mine operation. If you are a good politician, you are probably good at twisting any concept or problem into an overly reduced, seemingly simple, un-nuanced issue. Using the same methods, it may be intuitive (but certainly naive) to reduce mining to merely the act of getting rocks out of the ground. Anyone involved in mining anywhere knows it’s not that simple, even though that particular reduction-ism isn’t necessarily false. “Zooming in” on the mining industry reveals an overwhelmingly complex institution, and small changes can result in big outcomes.
In mining, tasks as simple & routine as breathing air become something that has to be considered and whose infrastructure needs to be built when working underground – by a team of people, no less. Furthermore, it is simple to assume that the cost of mining an ounce of gold is obvious and simple to calculate – however, calculating it is one of the largest logistical problems we face. Tracking mine expenditures is a lot more difficult than tracking a credit card, and optimizing those expenditures is effectively an unsolved problem. Choosing what areas to mine next is not so simple when the value of gold (or any mineral) is changing every day. Scheduling the tasks of the night shift electrician becomes irrelevant when all of a sudden the hoist trips-out. A routine maintenance check of a 40-ton battery electric haul truck might turn into a 5-day part replacement. Even “getting rocks out of the ground” becomes a logistical, technological nightmare when one remembers that the ore is 6000 ft underground! All of these things have an extreme impact on the output of a mine – and a small hiccup during a shift can lead to severe production shortfalls. All facets of mining are wildly unpredictable, chaotic, under-considered, and oversimplified to a fault.
If you watched the Mandelbrot zoom video linked above, you may have noticed that some structures and patterns were repeated as it zoomed in; For instance, in some places it looked like there was little Mandelbrot sets within the edges of the Mandelbrot set. When “zooming in” on the complications of mining, it’s no different – the same underlying issues can be seen at any level of the operation. Issues most often lie in poor communication, lack of technology, and strict time & monetary constraints. The reason that I cannot test the capacity of a li-ion cell in 20 minutes is the same reason as to why we can’t get wireless internet from surface to underground: the technology just isn’t there. While it may be easy to identify these issues, solving them is not so simple. Identifying and knowing that the Mandelbrot set is defined by the simple iterative function fc(z) = z2 + c does not make it predictable or intuitive in any sense of the word.
Anyway – I’ve spent too much time for a Tuesday morning discussing silly mathematical concepts that few people may ever naturally encounter or care about. Though for me, it’s always a great day when I’m able to draw these sort of comparisons. Using silly mathematical/physical concepts to help explain things about the mining industry is one of the ways in which I’m able to get excited about working here. My supervisor and I decided that turning simple things into fractals would be the world’s worst superpower. Though, perhaps the job of an engineer can be thought of as possessing this superpower and revealing the fractal-like nature of things to the world – a world in which problems are often portrayed to be more simple than they actually are. Nevertheless, I love fractals for their unsuspecting complexities and how they are the embodiment of the formal study of chaos theory, which oftentimes are the same reasons I like mining, too.
(October 27th, 2020)
